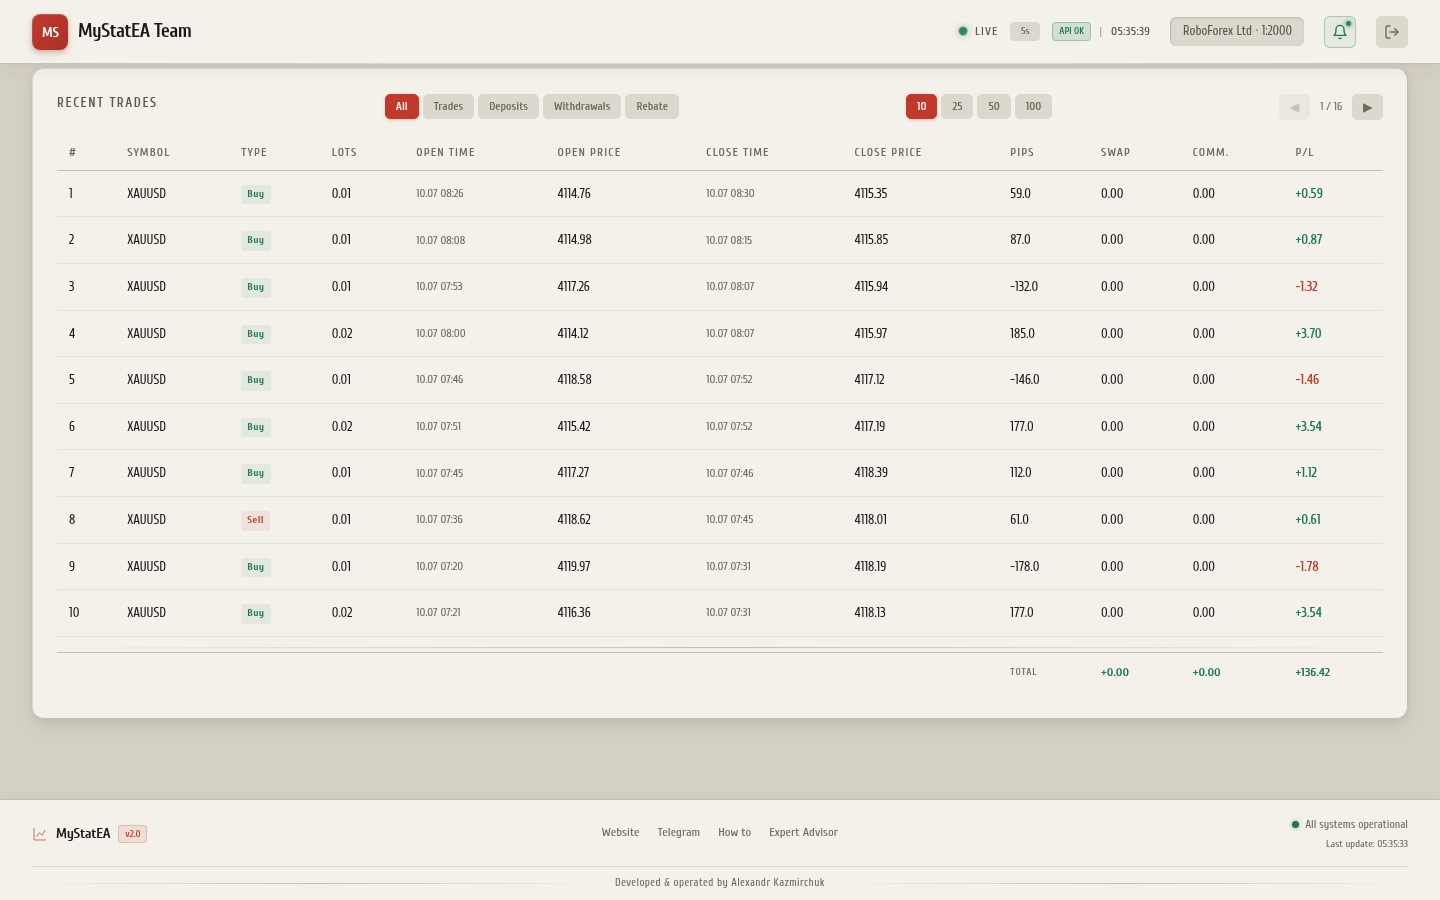
Drawdown is the decline in the value of a trading account from its maximum (peak) to the current or minimum value. Simply put, it's how much money you've "lost" (on paper or actually) since the last peak. Drawdown is one of the main risk metrics of a trading strategy, alongside Profit Factor and Sharpe Ratio.
In this article we'll cover what drawdown is, what types exist, how to control it, and what level of drawdown is considered acceptable for different types of strategies.
Types of Drawdown
1. Absolute Drawdown
The decline from the initial deposit to the minimum point. Shows how far the account dropped below the starting value.
Example: you started with $10,000, at some point equity dropped to $8,500. Absolute Drawdown = 10,000 − 8,500 = $1,500.
2. Max Drawdown
The largest decline from any peak to the subsequent minimum over the entire period. This is the key metric — it says "at the worst moment, you could have lost this much."
Max Drawdown is usually shown as a percentage:
Example: equity peaked at $15,000, then dropped to $11,500. Max DD = (15,000 − 11,500) / 15,000 × 100 = 23.3%.
3. Relative Drawdown
The maximum drawdown as a percentage of the peak, regardless of absolute values. Similar to Max DD, but sometimes calculated differently (per period separately).
4. Floating Drawdown
The current drawdown on open positions. This is how much you'd lose right now if you closed all trades. Can be positive (positions in profit) or negative (positions in loss).
For example, if your Balance = $10,000 and Equity = $9,200, the floating drawdown = $800 (8%).
Floating drawdown is an unrealized loss. Until you close the position, the loss is "on paper" — it can grow or turn into profit. But if Floating DD reaches critical levels, a Margin Call (forced position closure by the broker) may occur.
What Drawdown Is Considered Acceptable?
Depends on the strategy type and investment horizon:
| Strategy Type | Max DD Acceptable | Max DD Critical |
|---|---|---|
| Conservative (low-risk) | 5-10% | > 15% |
| Moderate (medium risk) | 10-20% | > 30% |
| Aggressive (high-risk) | 20-40% | > 50% |
| Martingale / grid | 40-70% | > 80% (often blown) |
If Max Drawdown exceeds 50% — this is a critical signal. Recovery from −50% requires +100% profit (to return to the peak). From −90% — you need +900%. The math is merciless: the deeper the drawdown, the harder it is to get out.
How to Control Drawdown
1. Set a Maximum Allowed Drawdown
Before launching a strategy, decide: "I will stop if Max DD reaches X%." Usually this is 20-30% for moderate strategies. Reached it — stop, reconsider your approach.
2. Use Stop-Losses
A stop-loss limits the loss on each trade. Without a stop-loss, a single trade can produce a loss that kills the entire strategy. The stop-loss size depends on the instrument's volatility and your risk model.
3. Risk per Trade — 1-2% of Deposit
The classic rule: don't risk more than 1-2% of the deposit on a single trade. With a $10,000 deposit and 2% risk — the maximum loss per trade = $200. To lose the entire deposit, you'd need 50 losing trades in a row (unlikely with an adequate strategy).
4. Diversification
Don't trade just one instrument. Spreading across 3-5 correlated pairs reduces overall Drawdown. If one pair is in drawdown — others can compensate.
5. Real-Time Monitoring
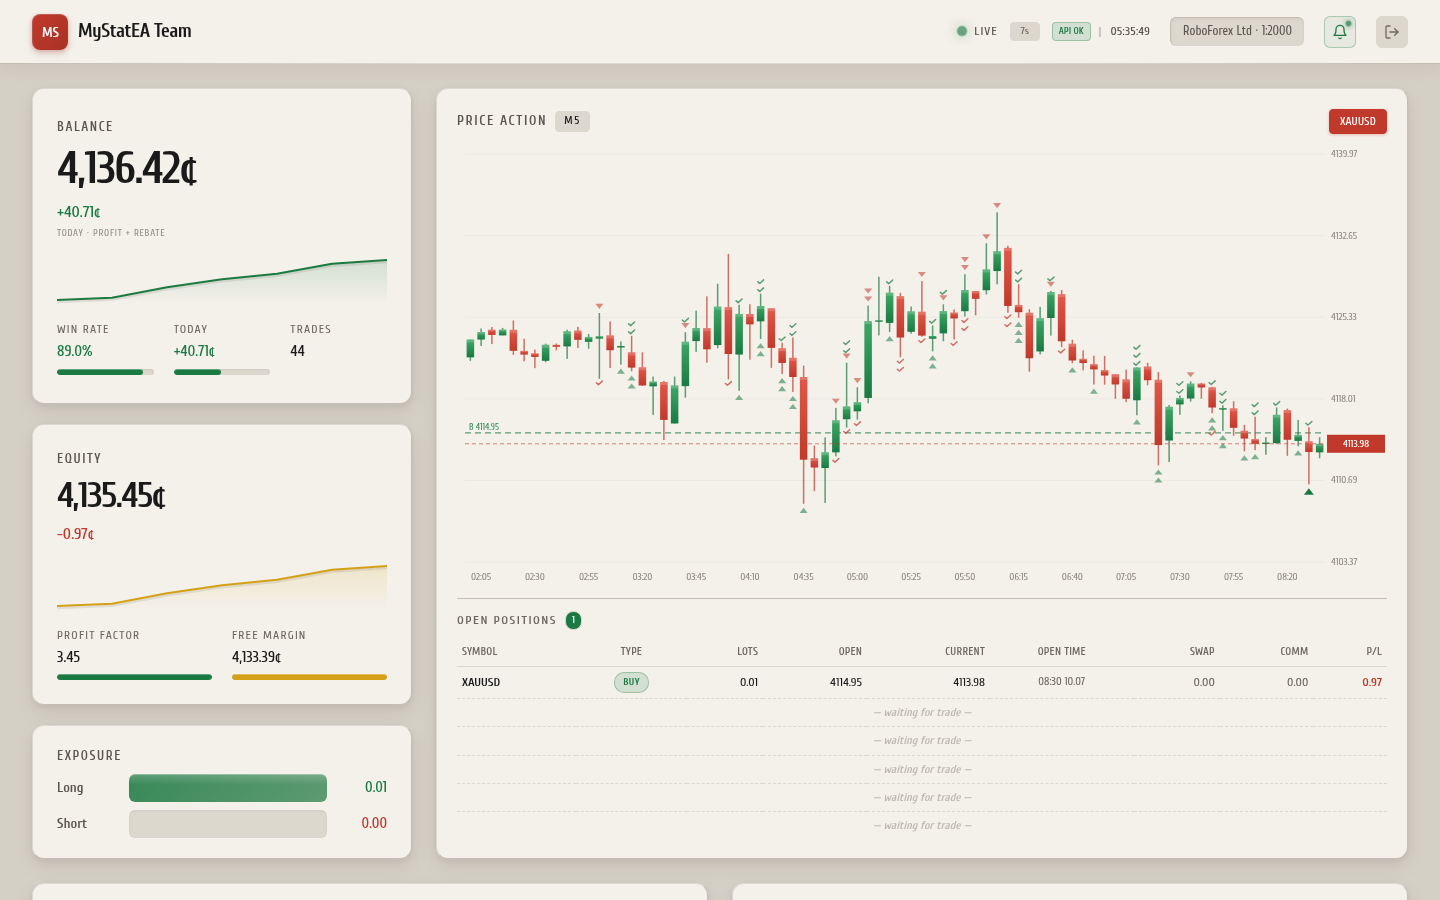
The most important thing — see Drawdown in real time, not after the fact. On the MyStatEA dashboard, Max Drawdown is displayed in the risk metrics block and updates automatically:
Recovery Factor — Drawdown Combined with Profit
Drawdown alone is not informative without profit. A strategy with Max DD 10% and 5% annual return is bad. A strategy with Max DD 30% and 80% annual return is excellent.
For comprehensive assessment, the Recovery Factor is used:
or
| Recovery Factor | Rating |
|---|---|
| < 1 | Bad — drawdown exceeds profit |
| 1 — 3 | Average |
| 3 — 5 | Good |
| > 5 | Excellent |
Margin Call and Stop Out — Critical Levels
If Floating Drawdown reaches certain levels, the broker starts forcibly closing positions:
Margin Call
The level at which the broker notifies you: "You have little free margin, either top up the account or close some positions." On RoboForex this is usually 100% Margin Level (Equity / Used Margin × 100).
Stop Out
The level at which the broker automatically closes positions (starting with the most losing one) until Margin Level recovers. On RoboForex usually 50-80%.
Monitor Free Margin (free funds). If Free Margin < 20% of Equity — you're in the danger zone. Don't open new positions, consider closing losing ones. The MyStatEA dashboard shows Free Margin in real time.
Setting Up Drawdown Alerts
One of the most useful features for controlling Drawdown is automatic notifications in Telegram. The MyStatEA bot (@mseaalert_bot) sends an alert if Floating Drawdown exceeds 15% of the balance:
⚠️ Drawdown 18.3%
Account: MyStatEA (#37372042)
Balance: 4879.62
Equity: 3986.21
Floating loss: -893.41
Time: 14:23:05
The alert comes no more than once per hour (to avoid spam during deep drawdowns). Upon receiving such a notification, you can:
- Open the dashboard and check open positions
- Make a decision — close part of the losing positions or wait
- Contact the trader if it's not your account
Setup takes 30 seconds: on the dashboard, click the 🔔 bell in the upper-right corner → the bot opens → Start → done.
FAQ — Drawdown in Trading
Frequently Asked Questions
Are drawdown and loss the same thing?
What Max Drawdown is considered catastrophic?
How to calculate Drawdown in MetaTrader?
Is it possible to trade without drawdowns?
What to do during a deep drawdown?
Conclusion
Drawdown is a critically important metric that many beginning traders ignore, focusing only on returns. But it's the drawdown that determines whether your deposit will survive an unlucky period. Monitor Max Drawdown, Floating Drawdown, and Margin Level — and use Telegram alerts to stay informed even when you're not at the terminal.
If you want to see Drawdown and other risk metrics in real time with Telegram alerts — connect the free MyStatEA dashboard. It automatically calculates all metrics after every trade and sends notifications on critical drawdowns.