Profit Factor (PF) is one of the key metrics of a trading strategy, showing the ratio of gross profit to gross loss over a given period. In plain terms: how many dollars of profit you earn for every dollar of loss. A PF > 1 means a profitable strategy; PF < 1 means a losing one.
In this article we'll cover the Profit Factor formula, examples, what values are considered good, how to calculate PF manually and automatically in MetaTrader, and how to track it in real time via a dashboard.
The Profit Factor Formula
Profit Factor is calculated as the ratio of the sum of all profitable trades to the sum of all losing trades over a period:
Where:
- Σ Winning Trades — the sum of all closed trades with a positive result (in money or pips)
- |Σ Losing Trades| — the absolute value of the sum of all closed trades with a negative result (we take the modulus so it's a positive number)
If you had zero losing trades during the period, Profit Factor is technically infinite. In practice, PF is set to 0 or shown as "N/A" in such cases. Only scammers have zero losing trades, so in real trading PF is always a finite number.
Profit Factor Calculation Example
Let's say you had 20 trades in a month. 12 profitable and 8 losing. Results:
| Trades | Count | P&L Sum |
|---|---|---|
| Profitable | 12 | + $4,800 |
| Losing | 8 | − $2,100 |
| Total | 20 | + $2,700 |
Calculating Profit Factor:
Profit Factor = 2.28. This means that for every $1 of loss, you earned $2.28 of profit. This is a decent one-off number, but how do we interpret it in the context of a trading strategy?
What Profit Factor Is Considered Good?
Professional traders and funds use the following scale to evaluate strategies by Profit Factor:
| Profit Factor | Rating | Comment |
|---|---|---|
| < 1.0 | Losing | Strategy loses money, needs to change |
| 1.0 — 1.2 | Weak | Barely breaks even, any drawdown will kill it |
| 1.2 — 1.5 | Average | OK for beginners, but risky |
| 1.5 — 2.0 | Good | Strategy is stable, can work with it |
| 2.0 — 3.0 | Excellent | Pro level, sustainable profit |
| > 3.0 | Suspicious | Too good — likely overfitting or small sample |
Profit Factor > 3.0 on a large sample (200+ trades) is extremely rare. If you see such a number, the strategy is likely overfit to historical data, or your sample size is too small. In real trading, PF > 3 is practically unheard of.
Limitations of Profit Factor
Profit Factor is a useful metric, but it has limitations you should know about:
1. Doesn't account for trade count
PF = 2.0 on 10 trades and PF = 2.0 on 1000 trades are different stories. A small sample is statistically unreliable. For a reliable estimate you need at least 50-100 trades, preferably 200+.
2. Doesn't account for Win Rate
Two strategies can have the same PF = 2.0 but radically different risk profiles:
- Strategy A: Win Rate 80%, avg profit $100, avg loss $400
- Strategy B: Win Rate 30%, avg profit $1000, avg loss $150
Both give PF = 2.0, but psychologically A is easy to trade, B requires nerves of steel (10 losses in a row is normal for B, a disaster for A).
3. Doesn't show drawdowns
PF says nothing about how deep the account can draw down within the period. For that you need to look at Max Drawdown and Recovery Factor (PF / Max DD).
How to Calculate Profit Factor in MetaTrader
MT4/MT5 doesn't have a built-in Profit Factor in the standard "Account History" report, but it's easy to calculate manually or get automatically.
Method 1 — Manually via the "History" tab
- Open the MetaTrader terminal (Ctrl+T)
- Go to the "History" tab at the bottom
- Right-click → select a period (e.g., "Last month")
- Right-click → "Save as Report" → an HTML file will be saved
- In the report, find the "Total Profit" and "Total Loss" rows
- Divide profit by the absolute value of loss → you get Profit Factor
Method 2 — Automatically via dashboard
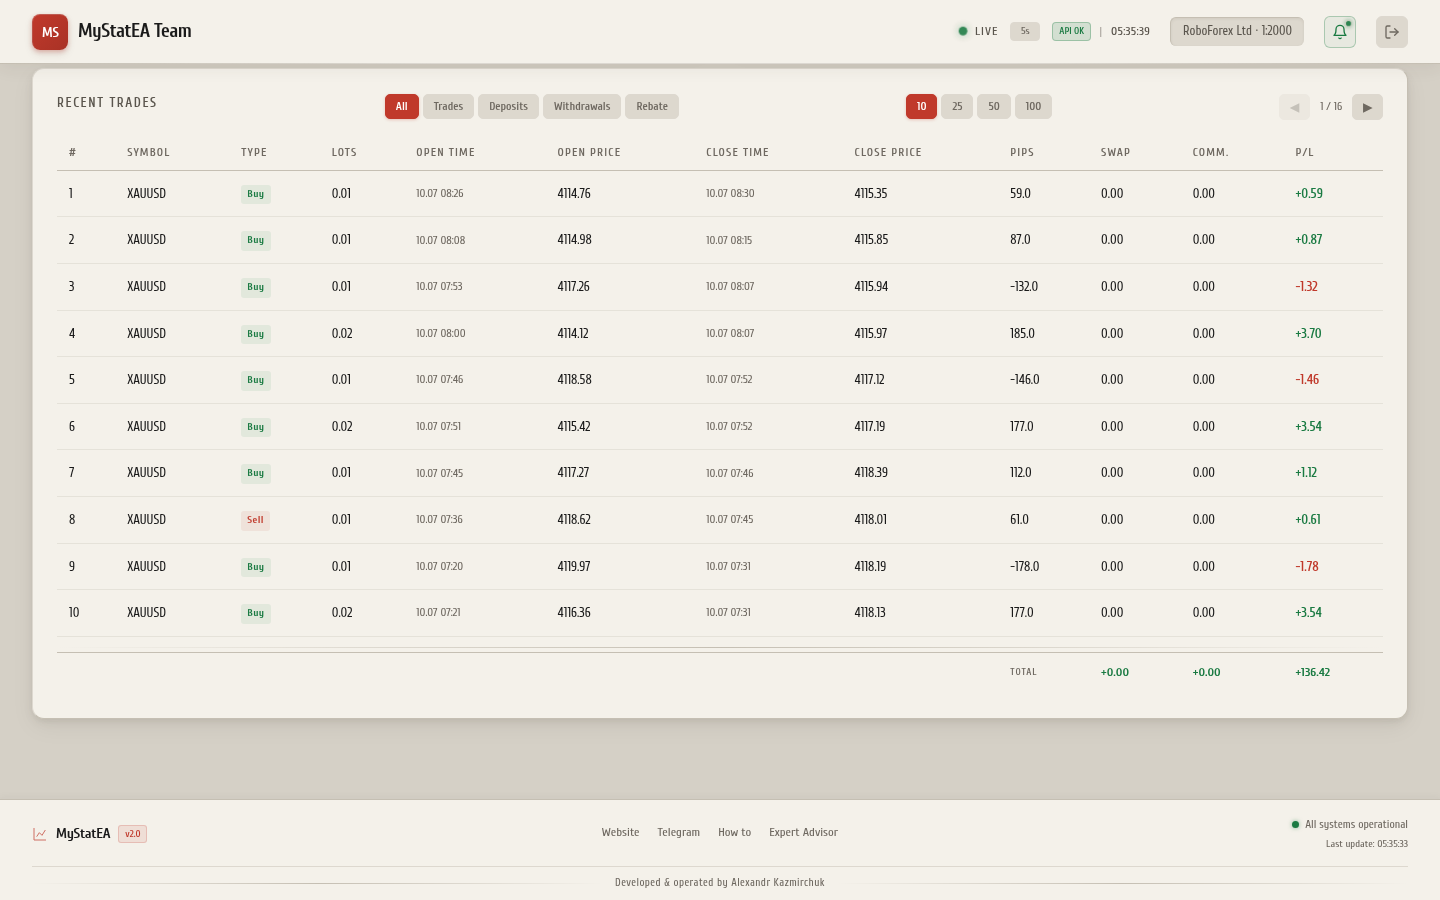
If you use MyStatEA, Profit Factor is calculated automatically after every closed trade and displayed on the dashboard in the risk metrics block. A screenshot of this block is shown at the top of the article.
The advantage of the dashboard is that you see Profit Factor alongside other metrics (Sharpe Ratio, Sortino Ratio, Win Rate, Max Drawdown) and can evaluate the strategy comprehensively, not just by one metric.
How to Improve Profit Factor
If your PF is below 1.5, here's what you can do:
1. Review your Risk/Reward ratio
Aim for RR of at least 1:1.5, preferably 1:2 or 1:3. This means the potential profit on each trade should be at least 1.5-2x the potential loss. Even with a 40% Win Rate, a strategy with RR 1:2 will be profitable.
2. Filter trades
Remove low-probability trades: against the trend, during news, in the Asian session if the strategy is designed for the European one. Fewer trades — but better quality.
3. Use a trailing stop
A trailing stop lets you "squeeze" more out of profitable trades by locking in profit as price moves in your favor. This increases the average profitable trade without changing the number of trades.
4. Don't hold losses
If the stop-loss triggered — exit. Don't move the stop hoping for a reversal. This increases the average loss and kills Profit Factor.
Profit Factor vs Other Metrics
Profit Factor should not be viewed in isolation. Here's how it relates to other key metrics:
| Metric | What it shows | Good value |
|---|---|---|
| Profit Factor | Profit-to-loss ratio | > 1.5 |
| Win Rate | % of profitable trades | > 50% |
| Sharpe Ratio | Return adjusted for volatility | > 1.0 |
| Sortino Ratio | Return adjusted for downside risk | > 1.5 |
| Max Drawdown | Maximum drawdown | < 20% |
| Recovery Factor | PF / Max DD | > 3 |
FAQ — Frequently Asked Questions
Frequently Asked Questions about Profit Factor
Can Profit Factor be negative?
What Profit Factor is considered bad?
Are Profit Factor and Win Rate the same thing?
How many trades do I need to calculate PF?
Is Profit Factor 3.0 good or bad?
Can I track Profit Factor in real time?
Conclusion
Profit Factor is one of the most useful indicators of a trading strategy, but not the only one. Use it together with Win Rate, Sharpe Ratio, and Max Drawdown for a comprehensive assessment. Aim for PF > 1.5 over 200+ trades — that's the mark of a stably profitable strategy.
If you want to see Profit Factor and other metrics in real time without manual calculation — connect the free MyStatEA dashboard. It automatically calculates all key metrics after every closed trade and sends notifications to Telegram.