MyStatEA is a free dashboard for monitoring MT4/MT5 trading accounts. It shows balance, equity, open positions, trade history, and professional risk metrics in real time. This article is a full review of its features with screenshots.
What the MyStatEA Dashboard Can Do
The dashboard covers all the key monitoring needs of a trader:
- 📊 Live account metrics — balance, equity, floating profit/loss
- 🕯 Candlestick chart with open position markers
- 📈 Equity curve (Absolute Return, ROI)
- 📜 Full trade history with filters and sorting
- 📅 P&L calendar by day
- ⚠️ Risk metrics — Profit Factor, Sharpe Ratio, Max Drawdown, Win Rate
- 🔔 Telegram alerts for every closed trade and drawdown
- 📱 Responsive design — works on phone, tablet, PC
Top Section — Balance and Equity
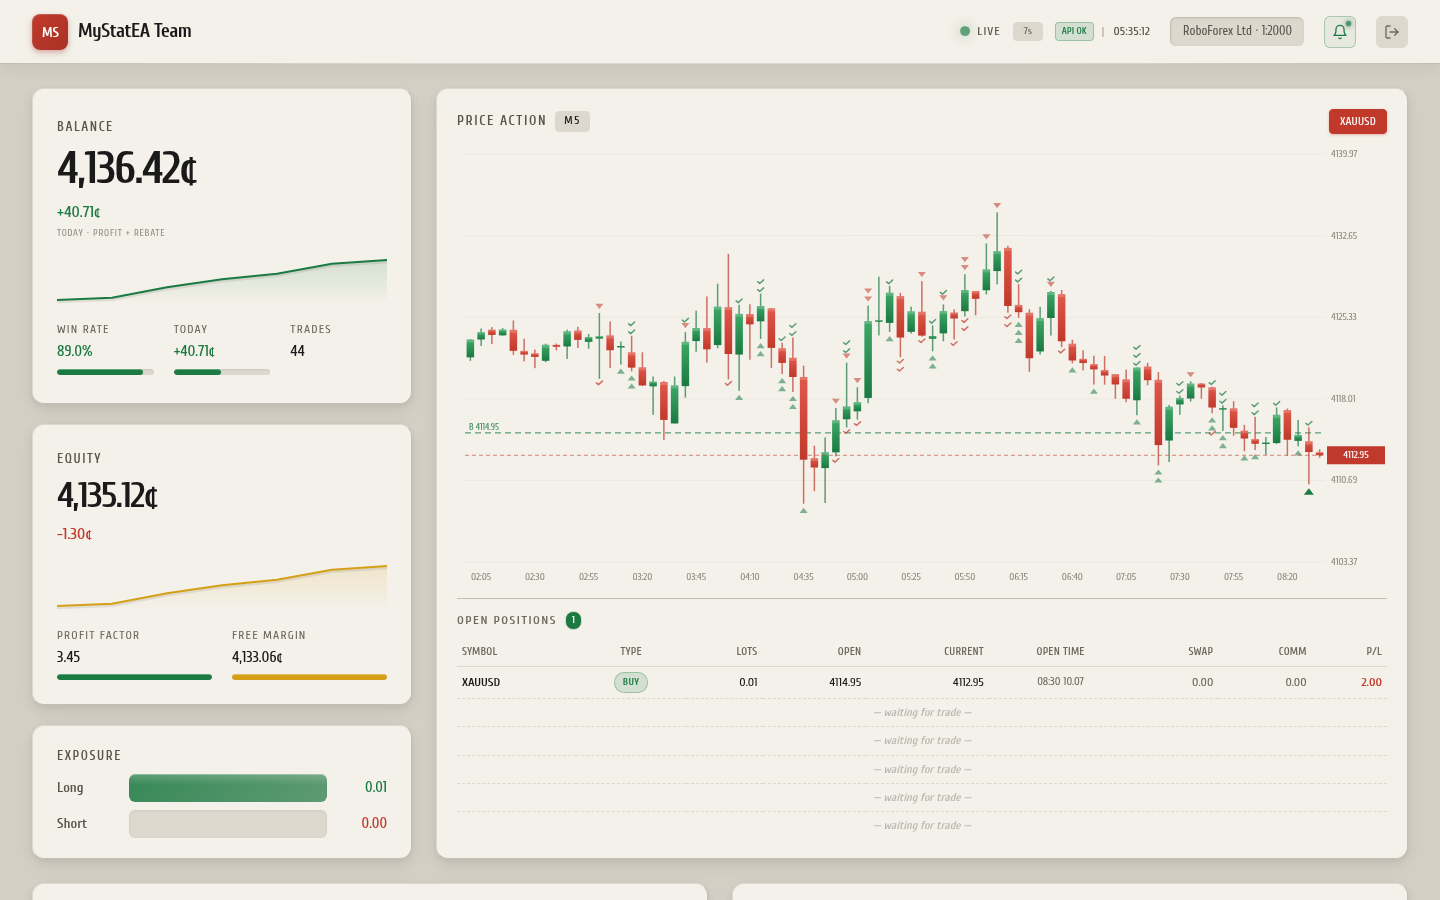
Top-left — two main cards:
Balance Card
- Account balance — current balance
- Win Rate — percentage of profitable trades
- Today — today's profit/loss
- Trades — total closed trades
- Sparkline — mini chart of balance dynamics
Equity Card
- Equity — balance + floating profit/loss
- Profit Factor — profit-to-loss ratio
- Margin — margin on open positions
- Free Margin — available funds
Next to them — two more cards:
- Today P&L — today's profit/loss with a progress bar
- Absolute Return (ROI) — total return since start, accounting for deposits and withdrawals
A screenshot of the top section with the cards is shown at the top of the article. All metrics update every 10 seconds automatically.
Candlestick Chart with Positions
The central part of the dashboard is a live candlestick chart. By default it shows XAUUSD (gold) on M5, but if other instruments are traded on the account — you can switch.
The chart shows:
- 🕯 M5 candles in real time
- 🟢 Green markers — open Buy positions (at entry price level)
- 🔴 Red markers — open Sell positions
- 📍 Entry and exit lines for each trade
- ⏱ Time in the broker's timezone
To the right of the chart — a list of all open positions: symbol, direction, lot, entry price, current profit/loss, open time. Sorted by current P&L descending.
Absolute Return — Equity Curve
A separate card shows Absolute Return (ROI) — the total return of the account since start. This is not just "balance / deposit", but a correct calculation accounting for:
- All account deposits
- All withdrawals
- Current balance
The formula:
This allows correctly comparing the returns of accounts with different deposit/withdrawal schemes. For example, if you deposited $10,000, withdrew $5,000 of profit, and now have $8,000 on the account:
Trade History
Full history of all closed trades with detailed information:
- 📅 Close date and time
- 🔢 Ticket (unique trade ID from the broker)
- 📈 Symbol (XAUUSD, EURUSD, etc.)
- ➡️ Direction (Buy/Sell)
- 📊 Lot size
- 💰 Profit/loss (green/red)
- ⏱ Position hold time
History is stored indefinitely — even trades from a year ago can be viewed. Sortable by any column.
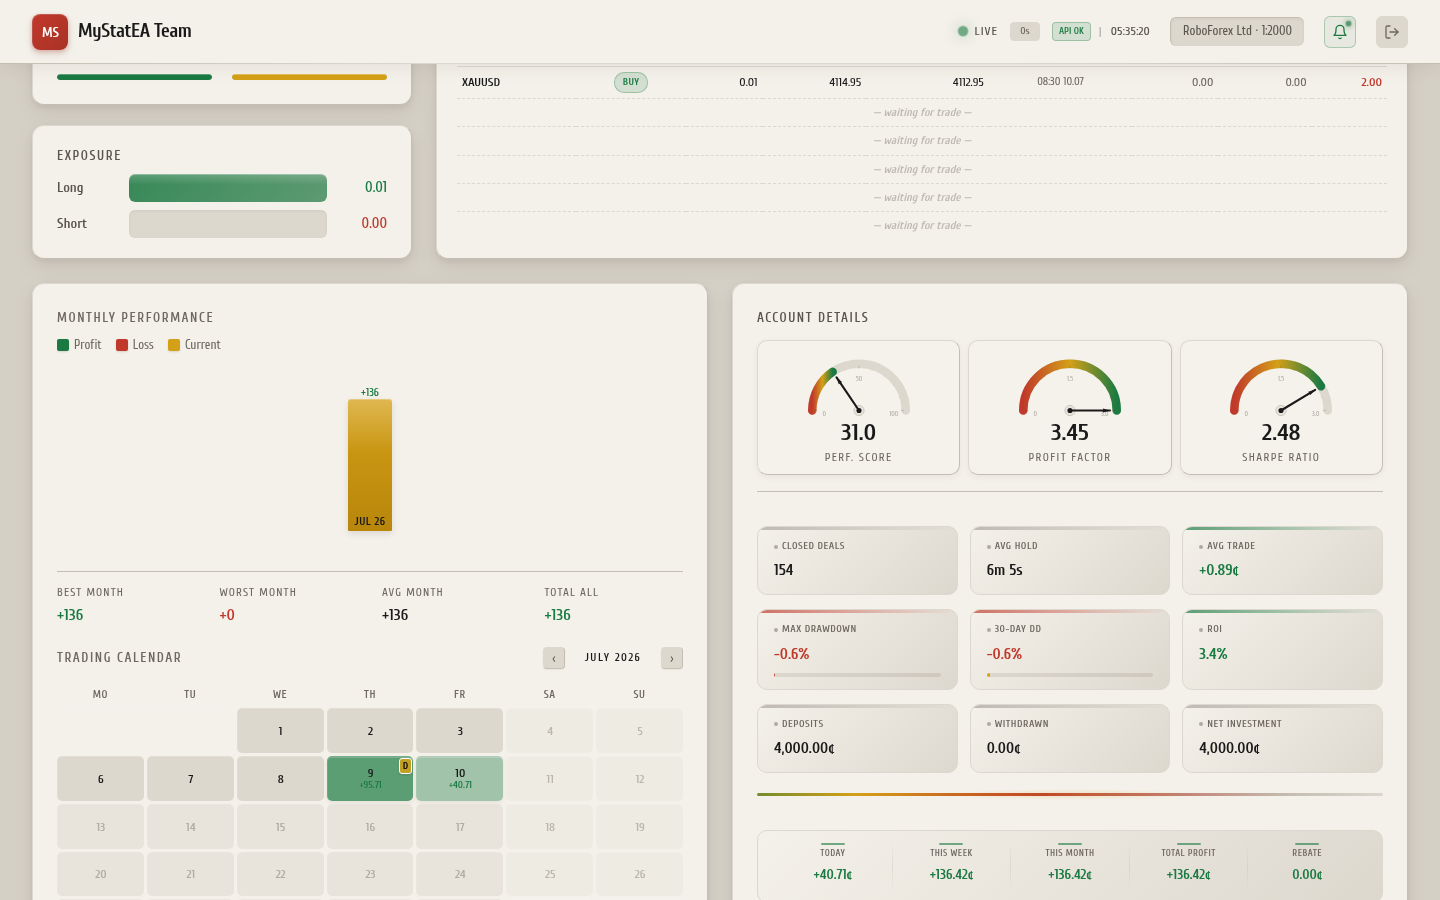
P&L Calendar
A unique feature of the dashboard — a profit and loss calendar by day:
- 🟢 Green days — profitable
- 🔴 Red days — losing
- ⚪ Gray days — no trades
- 🔢 Number in cell — daily P&L
The calendar is useful for:
- 📈 Evaluating overall dynamics
- 🔍 Finding lucky/unlucky periods
- 📊 Analyzing daily returns
- 🎯 Planning — average earnings per day/week/month
You can switch between months. Instantly see whether there's progress or stagnation.
Risk Metrics
At the bottom of the dashboard — a block with professional statistics:
| Metric | What it shows | Good value |
|---|---|---|
| Max Drawdown | Maximum drawdown over period | < 20% |
| Profit Factor | Profit-to-loss ratio | > 1.5 |
| Win Rate | % of profitable trades | > 50% |
| Sharpe Ratio | Return adjusted for volatility | > 1.0 |
| Sortino Ratio | Return adjusted for downside risk | > 1.5 |
| Recovery Factor | PF / Max DD | > 3 |
| Average Win / Loss | Average profit/loss per trade | — |
| Expectancy | Expected profit per trade | > 0 |
These are standard metrics used by funds and professional traders. They allow evaluating a strategy not by intuition, but by numbers.
Telegram Alerts — The Main Feature
Every time a trade closes — the @mseaalert_bot sends a notification to Telegram:
🟢 Trade closed
Account: MyStatEA (#37372042)
Direction: Buy
Symbol: XAUUSD
Lot: 0.80
Result: +125.50
Time: 2026-07-09 20:53:48

[📊 Open Dashboard]  [📋 Menu]
Plus the text — a widget image with the current balance, equity, ROI, and today's profit. The alert arrives within 2 minutes of the trade closing (cron checks every 2 minutes).
Two more alert types:
- ⚠️ Drawdown > 15% — hourly if Floating Drawdown exceeds 15% of balance
- 💰 Deposit / Withdrawal — any balance change
Setup takes 30 seconds — on the dashboard, click the 🔔 bell in the upper-right corner → the bot opens → Start → done.
How to Connect the Dashboard
Setup takes 2 minutes:
- Register a RoboForex account with partner code
gbop— this gives free access to the dashboard - Register at mystatea.ru/register/ — enter email, password, account number
- Download the EA from mystatea.ru/ea/ — MT4 or MT5 version
- Install the EA in MetaTrader — detailed guide on the /blog/install-ea-mt5 page
- Open the dashboard — data appears within 5-10 seconds
- Connect alerts — click 🔔 on the dashboard
How Much It Costs
Free for clients with partner code gbop. The service is funded by partner rebates from RoboForex — you register with the gbop code, we get a percentage of your trading commissions. It costs you nothing, and for us it pays for the service.
Without the gbop code, only a demo mode with limited functionality is available.
FAQ — MyStatEA Dashboard
Frequently Asked Questions
Is it safe? Won't the advisor steal my money?
What devices can I view the dashboard on?
Do I need to keep my computer on?
Can I connect multiple accounts?
Which brokers are supported?
Conclusion
MyStatEA is a full-featured professional dashboard for monitoring MT4/MT5 trading accounts. It contains everything a trader needs: live metrics, candlestick chart with positions, trade history, risk metrics, and Telegram alerts. Free for clients with the gbop partner code.
If you want to try it — register at mystatea.ru/register/, setup takes 2 minutes. If something doesn't work — write to our Telegram group, we'll help.